Showing posts with label Credit Market. Show all posts

Wednesday, May 22, 2013

Money, Credit and Collateral: Why Quality and Value Matter

The debate over liquidity deconstructed: creation of quality collateral is not sustainably possible via asset inflation schemes. Value and valuation cannot be consistently gamed and subverted.

A primary systemic risk in the 2007-8 financial crisis was relatively poor collateral underlying highly leveraged instruments. When interest rates rose due to Fed tightening after a sustained period of artificially low rates, those instruments became distressed once a negative equity condition was reached, and perhaps even prior to that condition, based on market anticipation. Duration mismatch for spread bets (borrowing short and lending long) was also an oversubscribed game, adding significant systemic risk. The evidence of these dynamics can be found in the growth of the collateralized debt obligation (CDO) and the repurchase agreement (repo) markets, among other related structured finance, debt and funding/financing markets, including mortgage backed securities (MBS), commercial paper, auction rate securities, etc. - this growth was geometric with a pronounced flare toward the 2007-8 crashes. The growth in these markets coincided with significant inflation in housing and commercial real estate, among other asset classes, and can be characterized as part of the "liquidity" bubble that fueled the asset price inflation, leading to unstable financial conditions, namely a catastrophic failure of structured financial instruments backed by inflated assets that ultimately provided the fuel to ignite other systemically wide failures. In short, parts of the financial system went from highly liquid to illiquid. The same trend occurred in Europe post-2008: from 2008-11 there was a pronounced growth in their CDO and repo markets, and inflation of similar asset classes, as well as sovereign debt. I have covered the data on these clear historical events in prior posts here, located below.

Post crises, the CDO, commercial paper, ARS,..etc. and repo markets were drained substantially and today they are reportedly nowhere near their peaks. What has not abated: the continued issuance of sovereign debt and MBS, setting records [1] in debt outstanding. Corporate debt issuance, both investment grade and high yield, are at record highs [2].

There is a prevailing school of thought that the Fed and other central banks must pump up this liquidity once again, in the case of the Fed by buying Treasurys and MBS (quantitative easing, or QE), and by leading the drive to a zero-bound interest rate environment (ZIRP). This has led to a record growth in the adjusted monetary base (AMB). As I pointed out HERE earlier in the year, this has not yet led to a growth in the velocity of money (VoM) as measured, but it most certainly has and is leading to asset price inflation across many asset classes, namely the U.S. equity and debt markets, which are sharply pegging new highs as I write this missive. In point of fact, all debt markets and related equity proxies are enjoying record price inflation as a result of Fed interventions, investor scrambling for yield/returns in a record low rate environment, and trend trading/chasing by market participants. Indeed, the pendulum has swung in the other direction, and there is even talk of pushing real interest rates further negative.

What has given the Fed license in part is the claim that broad inflation is low. However, traditional quantity theory of money (QTM) measures are not providing a useful tool for gauging inflation, particularly asset price inflation, and more to the point, the various funnels of hot money flow as a result of Fed policies and the reaction of market participants to its endogenous lead. QTM monetary measures do not accurately capture newly created monetary equivalents or credit money, or hot money flows. The Fed stopped reporting M3, which tracked repo and Eurodollar flows in 2006, and it has not been replaced by an improved metric. Liquidity as measured by new money equivalents, credit money and hot money flows that lead to asset price inflation are not part of any tracked metric. The AMB and excess bank reserves do not clarify the entire picture, and snippets such as margin debt have limited use, though these measures are again at the peak levels seen in 2000 and 2007. The view of some is that we remain in a "liquidity trap," that there is a dearth of borrowing and a propensity toward deflation. The reality is that we are coming off a significant era of inflation through disinflationary deleveraging, with a Fed providing a growing liquidity floor that has led to those funnels of hot money flow, record debt issuance by corporations and the sovereign, and asset price inflation. By inflating assets, collateralized debt and derivative instruments and collateralized funding markets become unstable if those instruments and markets are backed by inflated assets - enhanced by risks such as interest rate (duration) risk, among other risk factors. No amount of gaming or subversion of value and valuation of those assets will change this outcome. This is not sustainable, and nor is the issuance of "quality" debt at record low and lower rates. Broad real economic growth has been stagnant in the era of driven ZIRP, with asset price inflation providing a cheap high that has further systemic costs.

The point I want to leave the reader with is that the Fed and economic participants cannot create quality collateral via inflation of assets. Yet they keep trying to play this game, over and over. QED


[1] Data on issuance and outstanding levels of sovereign debt can handily be found at SIFMA for U.S. Treasurys and the BIS for ex-U.S. sovereigns. Data on issuance and outstanding levels of U.S. and Eurozone MBS and other structured debt instruments can also be found at the SIFMA link.

[2] Data on issuance of U.S. and ex-US corporate debt can be found at the SIFMA and BIS links above. The strong upward trends to net issuance and amounts outstanding are quite clear from 2010-12, with 2013 likely setting new records.


Tuesday, October 4, 2011

Credit Market Redux, Copper and China

TED Oct4 11 1yrMarkit iTraxx Europe Oct4 11

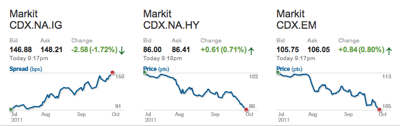
Markit CDX Oct4 11

Markit iTraxx Asia Oct4 11

China 5yr CDS Oct4 11

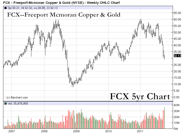
FCX Oct4 11VWO Oct4 11

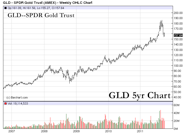
GLD Oct4 11XOM Oct4 11

The credit markets are rumbling again, as measured by the TED (LIBOR-OIS) spread and widening credit default swap (CDS) spreads. Though the latter have been intensely worse for European debt indices over the last 3-4 months from the play-out over Greece and faltering European banks holding PIIGS sovereign debt, increasing spreads are seen across global CDS indices (Europe, NA, Asia - see Markit curves above), a potential precursor to a global slowdown.

In the initial throes of the credit market induced selloff in October 2008, certain asset classes sold off quickly with sharp declines: Emerging Market (EM) equities and debt, commodities (especially copper, gold and oil). During the month of September 2011, we've seen a similar sharp selloff in these asset classes, minus commensurate participation from oil (so far). The declines in copper have come with speculation that China and other major copper holders are dumping copper onto the open market, creating selling pressure, in anticipation of a slowdown in Chinese housing and manufacturing growth.

If these selloffs are a true reflection of a coming global slowdown, then we may anticipate lower lows in copper (a futures curve asymptote to $2 and the equity proxy FCX below $20) as well as EM equities (VWO proxy $20 range). Though oil has not participated for a variety of reasons, it too could follow, leading to sharp declines in the majors and the commodity. Gold may be the exception again this time — it reached a relative low October 24, 2008, and rebounded from there, never looking back.

The flip side is that what we are seeing is a head fake, created by selling pressure from hedging activity.

The question then becomes: what are the catalysts to sharp market reversals to the upside with a sustained rise? European debt restructuring is a foregone conclusion, and may not lead to significant sustenance, given the debt levels involved and the uncertainty and disorder within the EU in general. Another quantitative easing binge by monetary authorities may give a lift, but as we've seen, the result leads to an uptick in commodity inflation mixed with stale real growth, while promoting continued debt accumulation and preventing debt deleveraging. Negative real interest rates and economic uncertainty from regulatory, tax and fiscal policies are hampering private investment.

Given this outlook, continued volatility is the most likely outcome. Hiding out in the Treasury and muni markets may not be a panacea, given the negative real returns and the latent risks. As commodities, equity majors and proxies reach lower lows, their attractiveness to acquire and hold rises, given the probability of continued inflation growth. Disinflation from debt deleveraging (while it is allowed to occur!) provides significant opportunities.

Sunday, June 12, 2011

Failed Fed Auction an Early Warning?

Not widely reported except by Bloomberg, the Federal Reserve (Fed) had a rare failed auction last week of mortgage-backed securities (MBS) "purchased" by the Fed from AIG during its $182.5B bailout in 2008/9. The Fed bought a total of $52.5B of MBS from AIG as part of the bailout package, forming the "Maiden Lane II" portfolio of distressed crisis assets on its balance sheet. Why should investors and traders care about this event? Keep reading.

In a June 8 dutch auction, investors only bought $1.9B of $3.8B of debt offered, causing market spectators to question the quality of MBS assets that AIG dumped on the Fed (or that the Fed overpaid for). The byline is that the Fed ended up selling the assets into a weak(ening) market, a casualty of bad timing. The irony is that the Fed was offered $15.7B from the rescued-and-lingering AIG for repurchase of the remaining $31B Maiden Lane II portfolio in March. Perhaps the Fed saw such a discount repurchase (reverse repo, actually) as a giveaway that would get too much press attention as a taxpayer loss, and decided that selling into the open market was a more tenable option. Credit markets in February-March were at a 2-year "high" of health, but have since deteriorated somewhat, with both MBS and corporate high-yield (junk) debt spreads increasing along with the price of credit default swaps for major banks and bond insurers.

So why should investors and traders care about this event? First, failed Fed auctions are a rarity. Second, the Fed has some $2.8T of "crisis assets" on its balance sheet [1], with ~$2T collected since fall 2008. Yes, the majority of those assets are Treasuries bought via quantitative easing asset swaps, and are AAA-rated, of the very highest quality debt (for now). Likely, the Fed won't be unwinding its balance sheet anytime soon, given some show of recent economic weakness and calls for even more quantitative easing from some quarters. The questions that arise are: Is selling into a weak market a destabilizer for credit/debt markets, and what is the risk of more failed auctions as the perception of quality deteriorates? Could those failed auctions ever be mint-Treasury auctions by the Treasury [2], forcing the Fed to continue loading its balance sheet and monetizing debt? And then there's always the question of all that muni-debt...

Note I am not just another "chicken little" on the issue of failed auctions and bond market turmoil, as the quality of debt has always been, and always will be, the paramount concern. If the 2008 crisis taught us anything, an oversupply of debt in the market can have destabilizing consequences, especially if quality of that debt declines. Investors and traders need to be vigilant of any signs of worsening conditions.

[1] Public view of the Fed's balance sheet can be found HERE.
[2] Newly-issued Treasury auctions can be tracked HERE.