Showing posts with label ZIRP. Show all posts

Wednesday, May 22, 2013

Money, Credit and Collateral: Why Quality and Value Matter

The debate over liquidity deconstructed: creation of quality collateral is not sustainably possible via asset inflation schemes. Value and valuation cannot be consistently gamed and subverted.

A primary systemic risk in the 2007-8 financial crisis was relatively poor collateral underlying highly leveraged instruments. When interest rates rose due to Fed tightening after a sustained period of artificially low rates, those instruments became distressed once a negative equity condition was reached, and perhaps even prior to that condition, based on market anticipation. Duration mismatch for spread bets (borrowing short and lending long) was also an oversubscribed game, adding significant systemic risk. The evidence of these dynamics can be found in the growth of the collateralized debt obligation (CDO) and the repurchase agreement (repo) markets, among other related structured finance, debt and funding/financing markets, including mortgage backed securities (MBS), commercial paper, auction rate securities, etc. - this growth was geometric with a pronounced flare toward the 2007-8 crashes. The growth in these markets coincided with significant inflation in housing and commercial real estate, among other asset classes, and can be characterized as part of the "liquidity" bubble that fueled the asset price inflation, leading to unstable financial conditions, namely a catastrophic failure of structured financial instruments backed by inflated assets that ultimately provided the fuel to ignite other systemically wide failures. In short, parts of the financial system went from highly liquid to illiquid. The same trend occurred in Europe post-2008: from 2008-11 there was a pronounced growth in their CDO and repo markets, and inflation of similar asset classes, as well as sovereign debt. I have covered the data on these clear historical events in prior posts here, located below.

Post crises, the CDO, commercial paper, ARS,..etc. and repo markets were drained substantially and today they are reportedly nowhere near their peaks. What has not abated: the continued issuance of sovereign debt and MBS, setting records [1] in debt outstanding. Corporate debt issuance, both investment grade and high yield, are at record highs [2].

There is a prevailing school of thought that the Fed and other central banks must pump up this liquidity once again, in the case of the Fed by buying Treasurys and MBS (quantitative easing, or QE), and by leading the drive to a zero-bound interest rate environment (ZIRP). This has led to a record growth in the adjusted monetary base (AMB). As I pointed out HERE earlier in the year, this has not yet led to a growth in the velocity of money (VoM) as measured, but it most certainly has and is leading to asset price inflation across many asset classes, namely the U.S. equity and debt markets, which are sharply pegging new highs as I write this missive. In point of fact, all debt markets and related equity proxies are enjoying record price inflation as a result of Fed interventions, investor scrambling for yield/returns in a record low rate environment, and trend trading/chasing by market participants. Indeed, the pendulum has swung in the other direction, and there is even talk of pushing real interest rates further negative.

What has given the Fed license in part is the claim that broad inflation is low. However, traditional quantity theory of money (QTM) measures are not providing a useful tool for gauging inflation, particularly asset price inflation, and more to the point, the various funnels of hot money flow as a result of Fed policies and the reaction of market participants to its endogenous lead. QTM monetary measures do not accurately capture newly created monetary equivalents or credit money, or hot money flows. The Fed stopped reporting M3, which tracked repo and Eurodollar flows in 2006, and it has not been replaced by an improved metric. Liquidity as measured by new money equivalents, credit money and hot money flows that lead to asset price inflation are not part of any tracked metric. The AMB and excess bank reserves do not clarify the entire picture, and snippets such as margin debt have limited use, though these measures are again at the peak levels seen in 2000 and 2007. The view of some is that we remain in a "liquidity trap," that there is a dearth of borrowing and a propensity toward deflation. The reality is that we are coming off a significant era of inflation through disinflationary deleveraging, with a Fed providing a growing liquidity floor that has led to those funnels of hot money flow, record debt issuance by corporations and the sovereign, and asset price inflation. By inflating assets, collateralized debt and derivative instruments and collateralized funding markets become unstable if those instruments and markets are backed by inflated assets - enhanced by risks such as interest rate (duration) risk, among other risk factors. No amount of gaming or subversion of value and valuation of those assets will change this outcome. This is not sustainable, and nor is the issuance of "quality" debt at record low and lower rates. Broad real economic growth has been stagnant in the era of driven ZIRP, with asset price inflation providing a cheap high that has further systemic costs.

The point I want to leave the reader with is that the Fed and economic participants cannot create quality collateral via inflation of assets. Yet they keep trying to play this game, over and over. QED


[1] Data on issuance and outstanding levels of sovereign debt can handily be found at SIFMA for U.S. Treasurys and the BIS for ex-U.S. sovereigns. Data on issuance and outstanding levels of U.S. and Eurozone MBS and other structured debt instruments can also be found at the SIFMA link.

[2] Data on issuance of U.S. and ex-US corporate debt can be found at the SIFMA and BIS links above. The strong upward trends to net issuance and amounts outstanding are quite clear from 2010-12, with 2013 likely setting new records.


Saturday, December 29, 2012

The Damage Caused By the Fed's Zero Interest Rate Policy (ZIRP)

Accounting for various inflation measures, the target and daily effective Fed Funds interest rate has been negative since 2009. The Fed has reiterated this so-called "zero interest rate policy" or ZIRP, indefinitely, and additionally has tied further monetary easing measures via bond and asset purchases not only to inflation, but to unemployment, regardless of the lack of evidence that such monetary measures positively affect growth leading to less unemployment. Rates on Treasury Inflation Protected Securities (TIPS) recently hit a record low yield to maturity of -1.496% on 4-year, 4-month issues, forcing the obvious question: Who would buy these things? Evidently, investors are willing to accept getting paid back less than the principal loan at maturity on the expectation that regular payments tied to the government's understated consumer price index (CPI) inflation measure will make up for the negative yield to maturity over the life of the loan - the auction was relatively strong, with a 2.7 bid-to-cover. The likely outcome is that investors will barely break even or lose money, given that inflation and risk will be running higher than expected or as sold to investors.

Creditors and savers lose money in this ZIRP environment, while debtors gain. That has been the goal of the Fed all along, to manipulate the cost of money so as to provide a bailout to all of those debtors, deleveraging or not. The accepted term for this ruse is appropriate: Financial Repression. What the Fed does not admit to is that this practice has significantly skewed the risk-reward for investors willing to lend money, and has created systemic risks tied to the interest rate markets. Both of these side effects have an impact on private investment, and by extension, real economic growth. On a basic level, investors willing to lend money want to see the level of risk tied to the potential reward, as set by market pricing, not as manipulated by a cartel. If that reward has a manipulated ceiling, or has a higher than expected probability of losses (negative reward) due to interest rate dislocations, defaults or other risks not priced in, then investors will shy away from taking any risk at all: they simply will hoard their capital and not lend. We've seen strong evidence of that in the last 3-4 years, as a result of an accommodative Fed feeding overextended debtors looking for a cushy reprieve from the housing and credit market bubbles the Fed helped to create.

Much talk has been made recently about how and when the Fed will proceed to raise interest rates and unwind its growing balance sheet of Treasury and Agency (MBS) securities, bought to keep interest rates artificially low for government borrowing, public mortgage financing and debtor refinancing. Existentially, there is a threat that interest rates could rise without a Fed change in ZIRP: the interest rate markets could dislocate rates higher to more accurately reflect risks. The danger is that dislocation could be severe and lead to significant losses in bonds and in interest rate sensitive securities and derivatives, including currencies. It has been my conviction that the Fed has not quantified this "Black Swan" event or series of events. The severity is potentially very high given the collaterized nature of Treasury and Agency securities within the global financial system, including the repurchase agreement (repo) markets. Rated securities used as accepted collateral experiencing significant sharp losses will have a systemic effect across the system. Critics answer this existential threat by stating that the Fed could simply flood the system with liquidity (printed money), in the magnitude and durations needed to restore stability. This is a fallacy; as I have pointed out in other essays, the Fed is an endogenous (not exogenous) entity, not unlike a large hedge fund, and the belief that it could perpetually print money to save its "system" is as wrong-headed as believing in perpetual motion machines. Trust is not infinite, and Federal Reserve Notes and Treasurys carry risks tied to trust.

Creditors and savers (investors) held hostage by the financial repression of ZIRP have little wiggle room other than to continue to push for changes in the powers carried by the Federal Reserve. Those powers are sold to all of us as a common good, when in fact it has led to an involuntary wealth redistribution scheme, a tax meant to benefit government and politically recruited debtors, with a leveler outcome of stagnant or negative real growth. At its worst, these powers have throttled systemic risks and will continue to do so, instead of unshackling markets and investors to allow for markets to set price levels and risk-reward curves based on supply and demand, and not on politically-motivated cartel manipulations.


Monday, October 10, 2011

Private Domestic Investment and Real Economic Growth: Why the Dearth?

RealGDP Jun 11

RealPrivInvest Jun 11

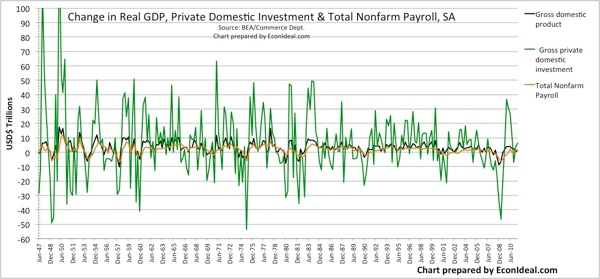
Those connected with econometric data are all too aware of the first chart. Less attention and focus goes to the components of real gross domestic product (GDP) and their trends, particularly private domestic investment (PDI), which historically leads to real economic growth and job creation. The correlation for this comes from looking at the change in real GDP, which responds to changes in PDI [1].

The historical trend for PDI has been relatively weak and muted, despite its multiplier effects on real growth and jobs. The period of the greatest compounded annual growth rate (CAGR) in PDI since 1947 occurred from June 1992 to June 2000 (9.3%; $985B to $2.01T). At the same time, growth in government expenditures was relatively flat (1.4%). Speaking to our trade deficit crisis, net exports (exports-imports) increased negatively at a CAGR of -36.6% (-$36B to -$439B). Personal consumption grew steadily (4.2%) with real GDP growth (4.0%), confirming the moniker "consumer-driven economy."

Since the "prolific" 1992-2000 period, the trend has reversed on PDI. From June 2000 to June 2011, PDI shrank with a negative CAGR of -1.1%, and the current value is stuck at around 2001 levels. While it is true that real GDP and the components kept growing until the 2006-7 pop in the mortgage bubble, PDI has not robustly recovered since the 2008 plunge. A large contributor came from the plunge in residential fixed investment, which we may classify as synonymous with personal consumption, given the hefty progression of homebuyers and speculators that took on mortgage debt and refinancings to finance further consumption. But what about nonresidential fixed investment? Why is it not showing healthy robust growth? Embarrassingly, government expenditures have outpaced at a 1.6% CAGR, and real GDP and employment remain flat to down.

What are the plausible causes of the dearth in PDI, specifically the contributions coming from nonresidential fixed investment? I provide a list below, which is by no means complete:

  • Government regulations are too many, too costly, without justifiable cost benefits
    • EPA, Labor Dept (employment regulations), Sarbanes-Oxley, Dodd-Frank, ...
  • Monetary and tax policies support/induce consumption/speculation, not investment (nonresidential PDI) that leads to solid job creation
    • Zero interest rate policy (ZIRP) and quantitative easing (QE) induce speculation and malinvestment, distorting risk-reward
    • Significant overseas profits remain unavailable for domestic investment due to punitive corporate tax policy
    • Tax code growth has coincided with providing vote-buying tax subsides linked to consumption; increasing complexity and uncertainty in the code represent a fundamental drag on business growth
  • Government expenditures crowd out PDI, and may have as damaging an effect in the future as mortgage debt consumption did in the recent past
    • Government stimuli (including subsides), social "entitlements" and welfare ($9T+ marketable Treasury debt, $5T+ non-marketable debt, $100T+ off-balance-sheet liabilities)
    • False safety in Treasuries and the sovereign credit rating

The bottom line is that unless we address the inhibitors to PDI, specifically nonresidential fixed investment, we risk stagnant growth (or worse) for the foreseeable future.

[1] The charts showing the correlated trend between real GDP and PDI, and total non-farm payroll and real GDP, are shown below:

ChangeRealGDP Jun 11

ChangeRealGDPvsPDI Jun 11ChangeNFPayrollvsRealGDP Jun 11

Sunday, June 19, 2011

Who Will Buy the Debt?

"Who will buy Treasuries when the Fed doesn’t?" is a question asked by major bond fund manager Bill Gross of PIMCO in his March 2011 Investment Outlook. Gross has come under considerable scrutiny for daring to divest his flagship Total Return bond fund of Treasury holdings post the late August QE2 announcement by the Fed/Bernanke, and in some timeframes thereafter apparently took short positions against Treasuries.

Despite the significant rally in Treasuries from mid-April, with a near 18%/10% decrease in the 10-yr/30-yr yields (leading to ~6-7% price appreciation on the market), Gross has essentially maintained his low-to-no position on Treasuries, with a 35% holding in cash equivalents, 21% mortgage debt, 18% high-grade corporate debt, and 20% equally split between emerging and developed market (mostly government) debt, shying away from municipal debt in a similar manner to Treasuries. Gross maintains he has "no regrets" over missing the recent Treasury rally, and recommends that bond investors should shift their weights to corporate or government debt issued by companies and sovereigns with far better balance sheets than the U.S. government (and also by implication, municipalities).

I submit the larger, more general question at this point should be: "Who will buy the debt?" Though debt-holders have continued (or have been forced) to de-lever from the credit market excesses that eclipsed in 2007/8, record debt issuance continues in the corporate markets and from the U.S. Treasury [1], thanks to historically low rates led by the Fed's zero interest rate policy (ZIRP) and ongoing permanent open market operations (POMO, or debt monetization).

Low yields mean investors may not be adequately compensated for the aggregate risks they are taking by buying the issued debt. Those risks include default, interest rate and inflation risks. The latter is already an issue: the real rate on the 5-yr Treasury note is currently negative [2]. Though default risks are in real terms lower for many high-grade corporates vs. our own sovereign debt, the current talk of sovereign default from Greece to the U.S. increases this risk span, yet rating agencies still rate Treasuries as AAA and the corporate-to-Treasury spreads are increasing as Treasuries rally. Interest rate risk (the risk that interest rates shoot significantly higher, sending bond prices sharply lower) is a real possibility that could lead to a broad market "event" not dissimilar to the Black Swan-type swoon we saw in 2008/9, except this time Treasuries may lack the "flight-to-quality" status that investors then sought for sanctuary while the stock, commodity, and non-government bond/debt markets all got pummeled. In this scenario, investors and traders may choose to dump some or all of their debt holdings (including Treasuries and munis), preferring not to get caught as prices fall, and therefore may trigger a cascade of selling and even sharper declines in prices.

As total outstanding debt continues to grow and yields are kept artificially suppressed, investors must ask why they should risk buying any debt if there is market volatility risk attached that could stem from default and/or interest rate risks. "Who will buy the debt" is the hazard for debt oversupply in any market, with markets increasingly correlated due to leverage and other factors.

[1] Total outstanding U.S. bond market debt as of Q1/2011 stands at some $35.5T, composed of $9.1T Treasury debt (26%), $7.6T corporate debt (22%), $8.5T mortgage debt (24%), $2.9T muni debt (8%), $2.9T money market debt (commercial paper, etc.)(8%), $2.5T federal agency debt (Fannie/Freddie, etc.)(7%), and $2T asset-backed debt (auto, credit card, home equity, student loan, etc.)(5%). The trend of this data since 2007 has clearly shown an increase of Treasury and corporate debt, and a leveling-out or decrease of all other types of debt, from the credit market deleveraging process. This data was sourced HERE from the Securities Industry and Financial Markets Assoc. (SIFMA). U.S. bond market debt is some ~39% of the total world-wide market debt estimated at ~$92T using Bank of International Settlements (BIS) data HERE. Note that these stats are total outstanding "market" or marketable/tradable debt, and not total outstanding market+non-market debt. I will discuss and source the latter in a future commentary, but the obvious example is the non-marketable U.S. Treasury debt that includes social security obligations, state and local government series bonds and savings bonds. 
[2] The U.S. Treasury has a nifty interactive yield curve flash app HERE, showing nominal vs. real rates and a historical rate comparison tool.